A Critical Breakthrough in Mapping Global Methane Emissions from Rivers and Streams
Peter A. Raymond, Shaoda Liu, Giuseppe Amatulli, Gerard Rocher-Ros, Emily H. Stanley, Luke C. Loken, Nora J. Casson and Ryan A. Sponseller
Nature
Methane emissions have contributed to about 30% of current global warming. A comprehensive understanding of methane sources is critical for climate modeling and mitigation. Freshwater ecosystems account for roughly half of global methane emissions in the atmosphere, but the specific amount is highly uncertain because estimates from rivers and streams vary widely.
To generate a more accurate estimate the scientists created a Global River Methane Database comprised of all empirical observations of methane rivers, 24,000 records of methane concentrations, and more than 8,000 measurements of methane emissions. The research team then combined those observations with high-resolution hydrological datasets that capture the movement of water in rivers and applied machine learning tools to predict global methane concentrations and emissions to provide the most comprehensive estimate to date of monthly methane emissions from rivers and streams worldwide. According to their findings, about 27 teragrams of methane is emitted globally from rivers and streams, which is about a quarter of the methane produced by fossil fuels. The research will help scientists working on the Global Carbon Project, which estimates global budgets for three main greenhouse gases—methane, carbon dioxide, and nitrous oxide—and investigates the complex system of the carbon cycle.

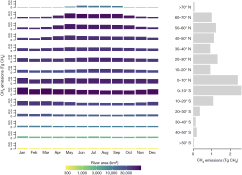
Fig. 3 | Seasonal patterns of CH4 emissions. Left: total monthly CH4 emissions for each latitudinal band (10° bins), with the colour representing total river area. Right: total yearly emissions for each latitudinal band. In the left panel, the y axis is square-root transformed, and the colour scale is log transformed.