Yale Himalaya Initiative, F&ES Map Risks in Post-Earthquake Nepal
The F&ES-based Yale Himalaya Initiative recently completed a map of Nepal that highlights the risk for landslides across the entire country, and hopes it serves as a launching point for future collaborations with Himalaya-based organizations.
By Timothy Brown
Note: Yale School of the Environment (YSE) was formerly known as the Yale School of Forestry & Environmental Studies (F&ES). News articles and events posted prior to July 1, 2020 refer to the School's name at that time.
In the days immediately following last year’s devastating 7.8-magnitude earthquake in Nepal, Yale faculty, staff, and students worked round the clock to assist with rescue and relief efforts. They translated UN reports for local Nepalese in New Haven and used social media to help check on the status of family and friends in Nepal.
But despite such an overwhelmingly positive response to the immediate crisis, Alark Saxena ’07 M.E.M., ’15 Ph.D., an Associate Research Scientist at the Yale School of Forestry and Environmental Studies (F&ES) and program director of the Yale Himalaya Initiative (YHI), was troubled by a persistent question: How can a research university like Yale actually help to rebuild a country?
“I was in Nepal right after earthquake and I asked people, ‘What do you need?’” Saxena recalls. “And everyone said, ‘We need help,’ but they didn’t know exactly what help they needed because they were just so overwhelmed by all sorts of challenges.”
Everyone said, ‘We need help,’ but they didn’t know exactly what help they needed because they were just so overwhelmed by all sorts of challenges.
— Alark Saxena
Saxena, an expert on climate change resilience, found an answer while touring the International Centre for Integrated Mountain Development (ICIMOD), an organization of eight member nations working to improve livelihoods and environmental sustainability throughout the Himalaya. While touring their headquarters in Kathmandu, Saxena observed a geographic information systems (GIS) lab where about 30 volunteers with only basic computer literacy skills struggled to identify and map landslides. All under the guidance of just one person: a man named Deo Raj.
“There was only one guy training them,” Saxena recalls. “And that’s what happens during an emergency. People have to deliver — you have a hard time thinking about the next five or six steps because you’re stuck on the first. It almost took me pulling [Deo Raj] aside and saying, ‘Talk to me. What do you want? How can we help you?’”
From this brief conversation, the Yale Himalaya Hazard Mapping Team was born.
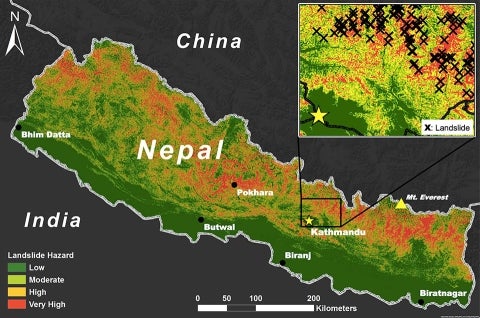
With support from Forrest Berkley ’76 B.A., the team has recently completed their first project: a new map of Nepal that shows the level of risk for landslides for the entire country.
When you think about an earthquake, landslides may not immediately come to mind. But they are a major concern in mountainous regions like the Himalaya where the geology is relatively young and unstable. After a quake, water percolates and loosens the soil, which can trigger massive landslides. Scientists estimate that there were tens of thousands of landslides throughout the Himalayan region in the weeks following the April 2015 quake. Whole villages were buried beneath layers of mud and rock. Hundreds died.
Saxena hoped a new map would help officials think about how to best reduce the risk for landslides, particularly in remote areas. “The first thing is to know if you are in a high-risk zone, and then to decide how to deal with it,” he says.
Back at Yale, Saxena assembled a team consisting of three recent F&ES alums — Ross Bernet ’15 M.E.M., who had specialized in GIS while a master’s student; Angel Herslet ’15 M.E.M.; and David J.X. Gonzalez ’15 M.E.Sc. — and a Yale College undergraduate, Olivia Walker ’16. Jonathan Reuning-Scherer, a senior lecturer in statistics at F&ES, provided technical support.
They first reviewed the literature to learn how scientists typically assess natural hazards. Building on preliminary data from Deo Raj, they then created a model to identify high-risk areas. Their model incorporated elevation, aspect, slope, roads, population centers, rainfall patterns, and drainage systems. Somewhat surprising, their regression suggested that geologic fault lines are not as important as many other factors in predicting landslides.
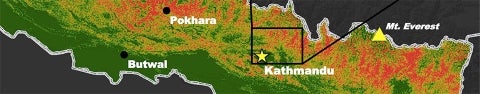
The resulting map uses different colors to delineate four hazard classes in Nepal: low, moderate, high, and very high. One can easily see those areas most at risk, and they might not be where you’d think.
While the media tends to favor urban areas, the map suggests these populations are not necessarily at risk for landslides. For example, most of Kathmandu faces a relatively low risk. However, wet, rural areas are highly susceptible. And climate change is exacerbating monsoon patterns throughout the South Asian Peninsula, including Nepal, where current models predict warmer temperatures and increased rainfall. If these models prove to be correct, parts of Nepal could be at even greater risk for earthquake-induced landslides.
Saxena acknowledges that maps such as this can be highly controversial. “Maps can become really politically charged because you can use them to decide whether you’re going to stay in your village or you’re going to move,” he says.
And although it can be tempting to read the map as absolute truth, Bernet cautions that all maps are highly subjective. “We’re trying to tell a story. That’s the point in creating them,” he says. “But what you focus on — the shapes and colors and line thickness — all influence how you read the map. And I think it’s super important as you’re creating a map to remember what people are getting out of it.”
“Our model is 84-percent accurate based on the data we had,” he continues. “We’ve said, ‘Here’s where we found the data, here’s what we’re working with, here’s what we did.’ The hope is that someone who might be using the map to make decisions that affect people’s lives really understands all of that.”
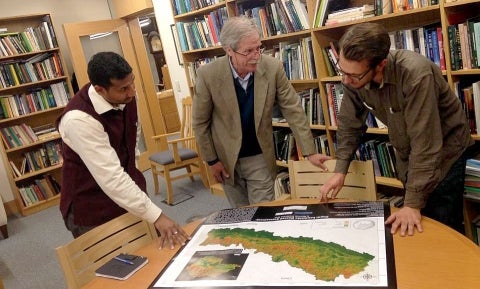
From left: Alark Saxena, Program Director at YHI, David Molden, Director General of ICIMOD, and Ross Bernet, who led the mapping project.
The team sees the map a launching point for future projects and collaborations. While the map is focused on a physical hazard, Saxena says we need to start thinking about landslides within the larger context of migration so we have a better idea of the social-physical hazards in the region.
“Models are small stepping stones, but have many benefits,” Saxena explains. “For example, now that we’ve established a strong working relationship with ICIMOD, the Yale Himalaya Initiative wants to provide resources and collaborate in such a way that our researchers can join hands and bring strength to the work that’s happening there. And alumni and students can actually help develop this. So this is a new way for us to say that we’re committed, we’re going to keep working on this, and this is the direction we want to head.
“I think that’s what these initiatives are meant for,” he continues. “YHI is an interdisciplinary platform that looks at the entire Himalayan region as a transregional whole. Which means we’re not focused, or dependent, or restricted by a political boundary, but rather we look at the entire region. For example, this same model can be used in Afghanistan, or Pakistan, or India. And all of those can be useful.”
My hope for the map is that an institution like Yale can continue to stay relevant to other organizations that are embedded in other parts of the world, dealing with major issues.
— Alark Saxena
Hertslet echoes his sentiments. “My hope for the map is that an institution like Yale can continue to stay relevant to other organizations that are embedded in other parts of the world, dealing with major issues.”
“There are two ways I can imagine this partnership continuing,” Bernet says. “One is working further with ICIMOD. They are putting together this team that’s looking into the role of participatory mapping, like how do you get these people involved. They know it’s important. So is there a role for us there?
“And the second is in the direction of a Google Earth grant, because in some ways it seems like the perfect candidate. Google Earth is super powerful engine for incorporating live data. So you could create a model that is incorporating the most recent rainfall and is super dynamic and can be zoomed in to a really fine detail. But Google is still trying to figure out what is the role of Google Earth engine and how it can be used by others.”
Both Bernet and Hertslet say the project meant a lot on a personal level. As team leader, Bernet says his time at F&ES was critical in being able to produce the map. “I couldn’t have done this before starting at F&ES. In terms of technical GIS skills, how I think about maps, how they can be used, that’s all straight from Dana [Tomlin’s] class,” he says.
“A big part of my time at F&ES was Gordon Geballe’s course [on post-disaster development] in Haiti. And this is a parallel for me,” Hertlset says. “Nepal is an earthquake-torn country, and there’s a local organization that’s interested in collaborating with Yale and F&ES.
“If Deo Raj said, ‘This is useful and I want to continue this relationship and let’s move forward together,’ that would be a success even if the map is never used by a government official.”
 From left: Alark Saxena, Program Director at YHI, David Molden, Director General of ICIMOD, and Ross Bernet, who led the mapping project.